Open interest explained: positions opened, positions closed
What open interest counts that volume does not, the four combinations of price and open interest, why cascades show up as sudden drops, and how to read the bars on Coinlytic.
On this page
Volume tells you how much traded. Open interest tells you how much is still on the books afterwards. On a perpetual future, where a position can stay open indefinitely on borrowed exposure, the second number says more about how much leverage is sitting in the market.
Two definitions
In the CFTC glossary, open interest is the count of futures contracts that are still outstanding: no offsetting trade or delivery has closed them yet. Volume is the number of contracts traded during a period.
Every open contract has a long holder and a short holder. Open interest cannot grow on one side alone: each new long position is matched by a new short one.
Three trades, step by step
Volume only goes up. Open interest goes up, down or nowhere, depending on whether each side of a trade is opening or closing. Take one hypothetical contract:
- Trader A buys 1 from trader B. Both open new positions. Volume 1, open interest 1.
- Trader C buys 1 from A. A closes, C opens, and the position changes hands. Volume 2, open interest still 1.
- B buys 1 from C. Both close. Volume 3, open interest 0.
Three trades, and nothing remains open. High volume on its own says little about how much exposure the market carries.

Price and open interest together
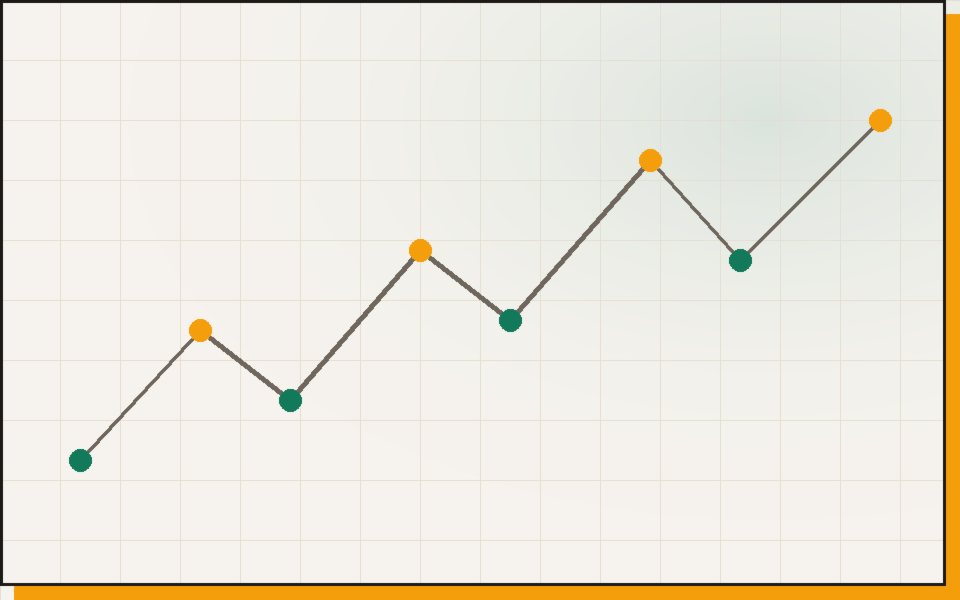
Price shows which side was more aggressive. Open interest shows whether positions were added or removed. The four combinations below describe what happened; they do not forecast what comes next.
- Price up, open interest up: new positions opened while buyers paid higher prices. New longs and new shorts were both added; the longs were the ones lifting offers.
- Price up, open interest down: positions closed into a rising market. The usual reading is shorts buying back, by choice or by force.
- Price down, open interest up: new positions opened while sellers pressed lower, with new shorts as the aggressive side.
- Price down, open interest down: longs selling to close, or being liquidated.
Each reading is net. A 2% rise in open interest can hide much larger opening and closing flows that partly cancel out.

Liquidation cascades in the open-interest line
A liquidation is a forced close. When a fast move pushes many leveraged positions past their liquidation prices, the exchange sends closing orders into the book. Open interest falls only when the other side of those fills is also closing; if a new trader takes the other side, the position simply changes hands.
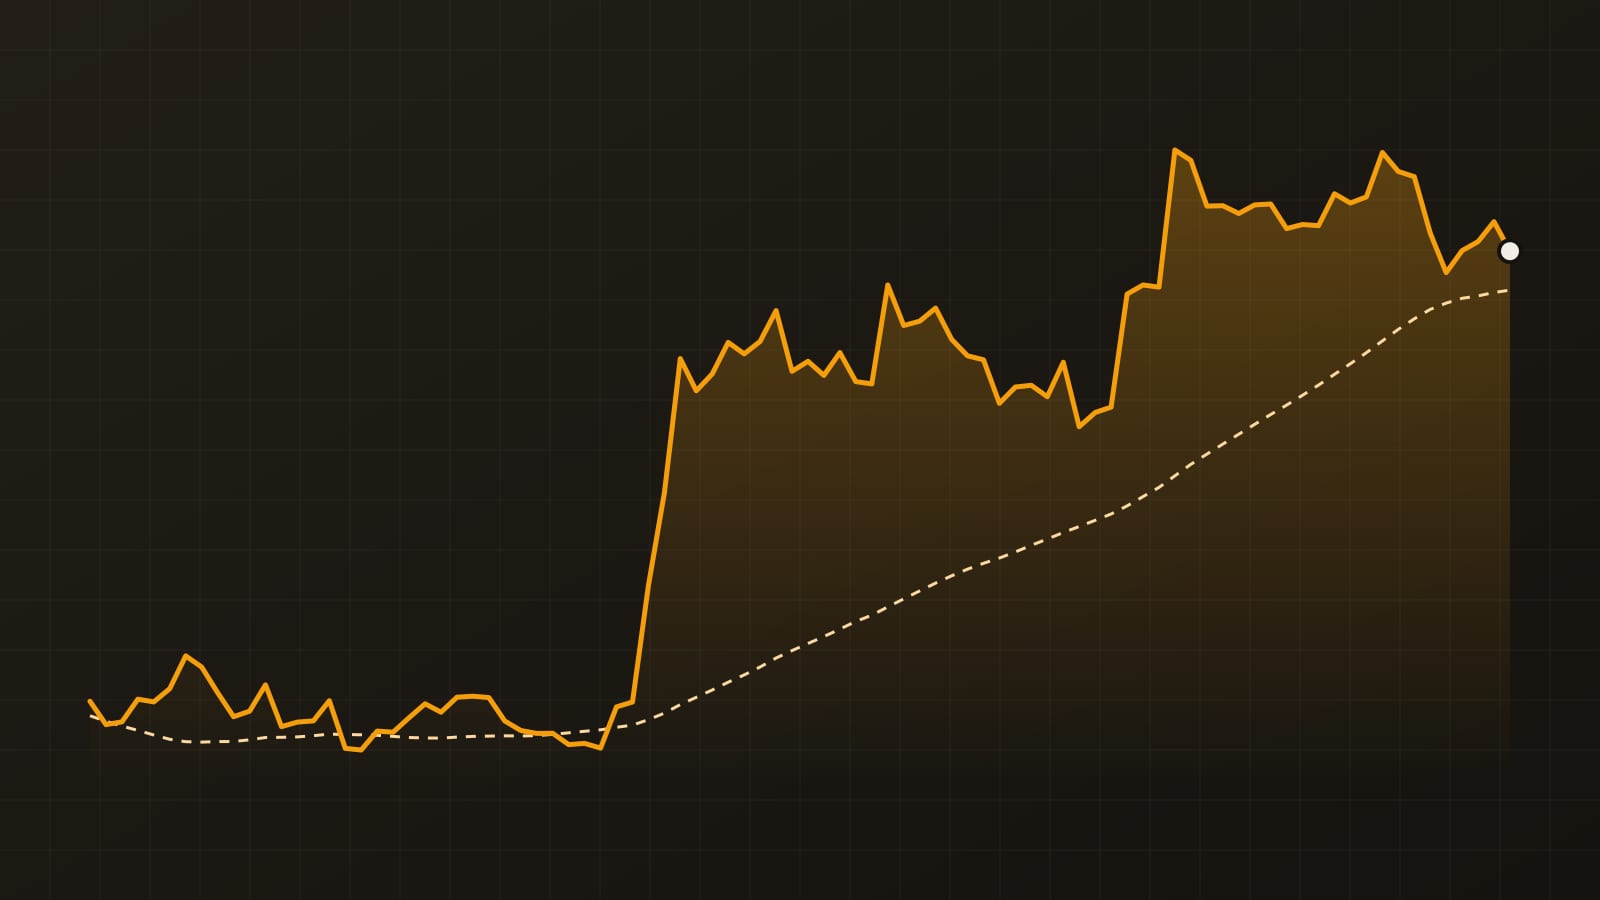
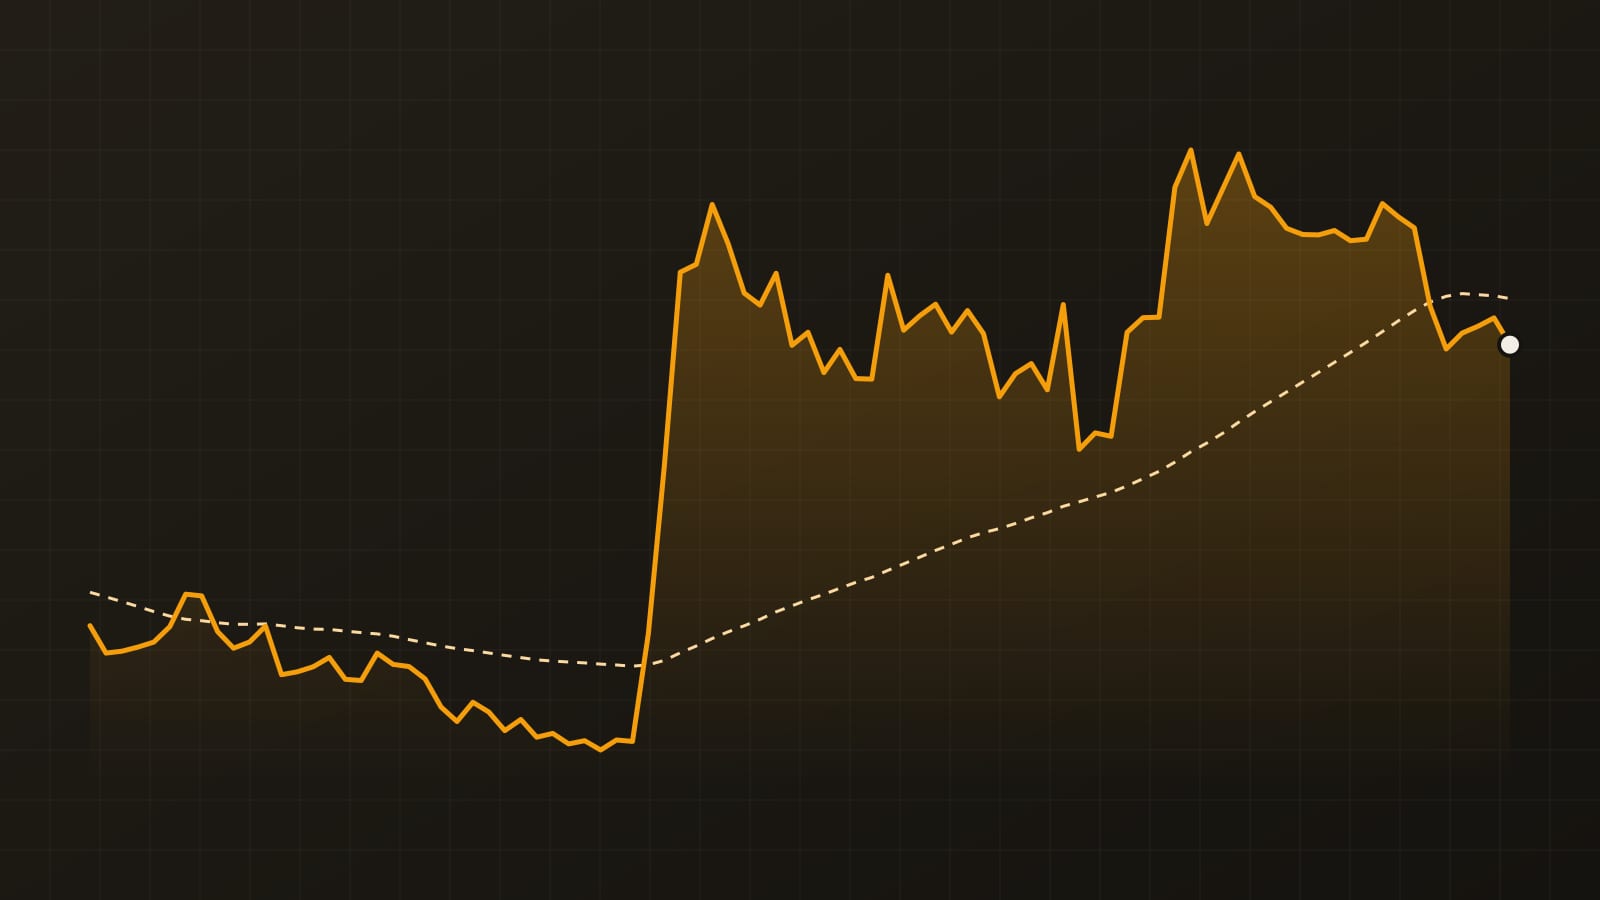
In a cascade, many fills are closes on both sides, so open interest tends to drop in steps that line up with the long candles. Afterwards, less leverage remains in that market. That says the crowd got smaller, not that the move is over. Check funding next, because the rate now reflects who is left.
Dollar open interest moves with price
Coinlytic shows open interest as a dollar value: contracts × price. That value rises when price rises, even if no position was added.
Assumptions: 10,000 BTC of open interest at 40,000 USDT, worth 400 million. Price rises 5% to 42,000. With no new positions, the value becomes 420 million. If the panel shows 441 million, open interest in coins is 441 million ÷ 42,000 = 10,500 BTC: real growth of 5%, not the 10.25% the dollar figure suggests.
Reading Coinlytic's open-interest bars
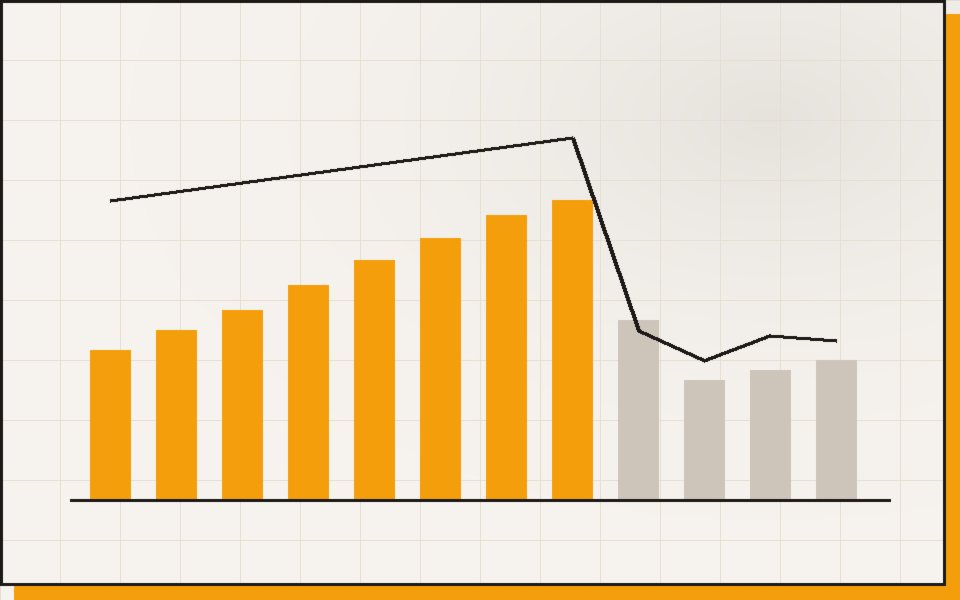
In the Perpetual futures panel on the home page, each coin has an amber bar and a dollar value. The bar is scaled to the coin with the largest open interest in the panel, so it compares coins with each other at one moment. The header adds up the total across all coins shown.
The figures come from Bybit's public market data for USDT perpetuals, so they describe one venue, not the whole market. Each view is a snapshot refreshed every few minutes. To read a change, note the value, come back later, and set it against the price move over the same window.
Questions for a written plan
- Did open interest rise or fall over the move I am looking at, after adjusting for the price change?
- Which side does the funding column say is paying, and has open interest on this coin been building alongside it?
- If a cascade ran through my side of the market, where would my liquidation price sit relative to the obvious levels?
- Is this coin's open interest on this venue large enough for the reading to carry weight?
For education only, not financial advice. Trade examples are illustrative. Crypto prices are volatile, and leveraged trading can lose more than your margin.
Get one trade plan like this each week
Setup, stop, size and review in one email. Free, unsubscribe anytime.
Mid-week market-structure notes on Telegram: @ispsjaolqMarket brief
Latest news