Market structure: reading swing highs and lows without guessing
A simple rule for marking swings, the three states a market can be in, and what a break of structure actually tells you.
On this page
Two traders can look at the same chart and disagree about the trend because they picked different swing points. A fixed rule for marking swings removes most of that argument.
A rule for swing points
A swing high is a candle whose high is above the highs of the two candles on each side. A swing low is a candle whose low is below the lows of the two candles on each side.
The rule is mechanical, so you mark the same points every time. A swing is only confirmed two candles after it forms, which is the price of not guessing.
Three states a market can be in
- Uptrend: higher highs and higher lows. Each pullback stops above the previous swing low.
- Downtrend: lower highs and lower lows. Each bounce stops below the previous swing high.
- Range: neither pattern holds. Price moves between the last confirmed swing high and swing low.
Break of structure
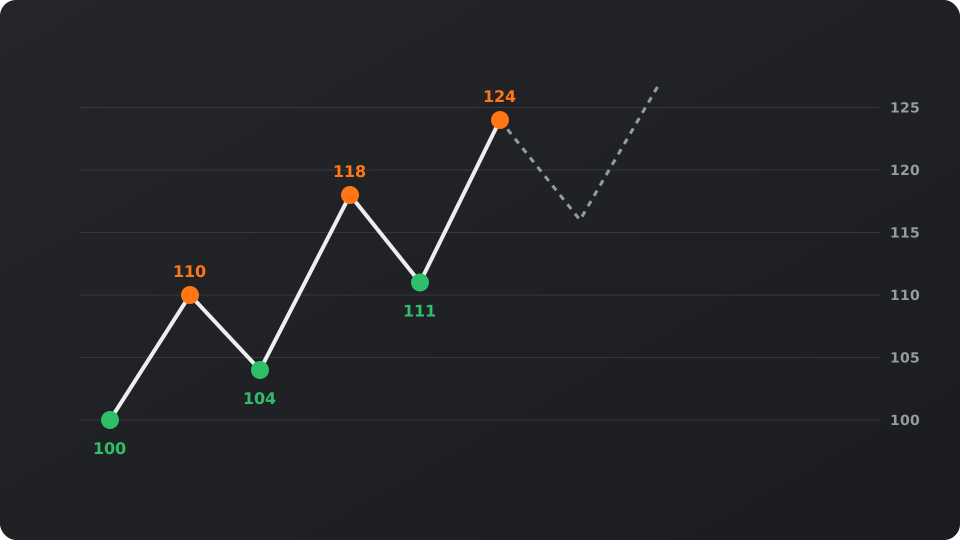
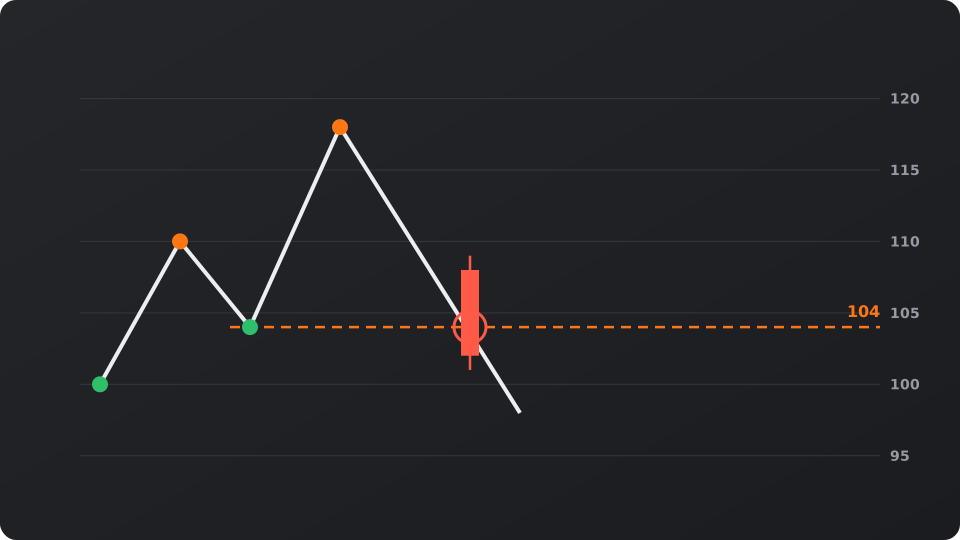
In an uptrend, the level that matters is the last higher low. A candle that closes below it means the sequence of higher lows has ended. That is a break of structure.
Example, using assumed prices: swing lows at 100 and 104, swing highs at 110 and 118. A close below 104 breaks the uptrend. It does not prove a downtrend; it says the uptrend is no longer intact, so trend-following longs lose their reason.
Using structure in a plan
- Read structure on one higher timeframe for direction, then plan entries on a lower one.
- Place the stop beyond the swing that would break the structure your trade depends on.
- Treat a wick through a level and a close through it differently; the rule uses closes.
- In a range, the edges matter more than the middle, and breakouts fail often.
Timeframes that disagree
A 4H downtrend can contain a 15-minute uptrend, so two timeframes often disagree. Decide in advance which timeframe sets the direction and which one times the entry, and write both in the plan.
A common pairing keeps a ratio of about four to six between them, such as 4H with 1H, or 1H with 15 minutes. If the lower timeframe breaks structure against the higher one, treat it as a pullback until the higher timeframe breaks too. That rule stops you from flipping your bias on every small swing.
For education only, not financial advice. Trade examples are illustrative. Crypto prices are volatile, and leveraged trading can lose more than your margin.
Get one trade plan like this each week
Setup, stop, size and review in one email. Free, unsubscribe anytime.
Or follow the Telegram channel @ispsjaolqMarket now
Latest news