Reward-to-risk and win rate: the break-even math
A 2:1 setup only needs to win one time in three to break even. How the two numbers work together, and where fees bite.
On this page
A strategy can lose more often than it wins and still make money, or win most of the time and still lose. Two numbers decide which: how much you make on winners compared with losers, and how often you win.
Measure everything in R
R is the amount you risk on a trade: the distance from entry to stop, times the size. A trade that hits the stop loses 1R. A trade that makes twice the risked amount wins 2R.
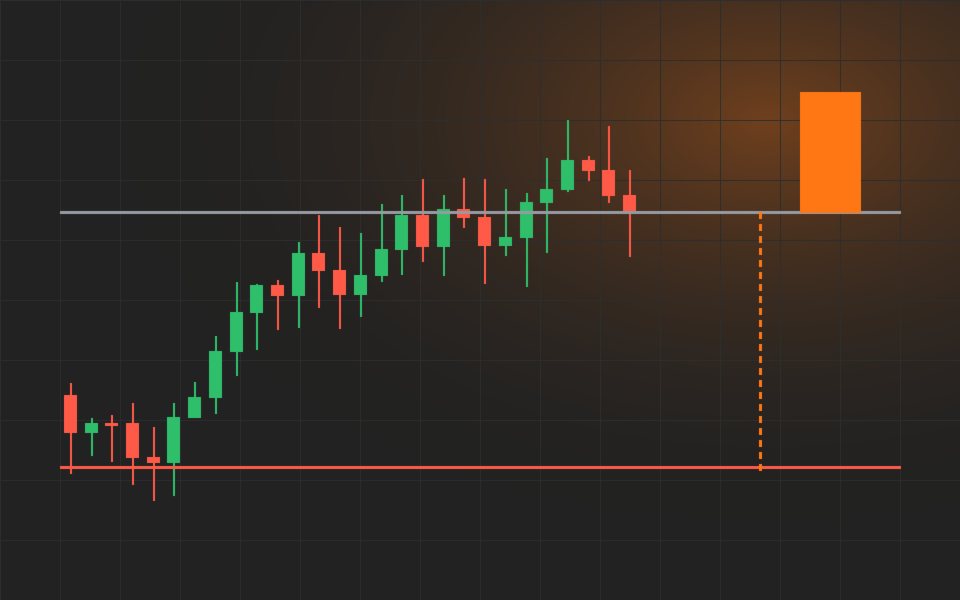
Reward-to-risk is the planned win divided by the planned loss. An entry at 100 with a stop at 98 and a target at 104 risks 2 to make 4: a 2:1 setup.
The break-even win rate
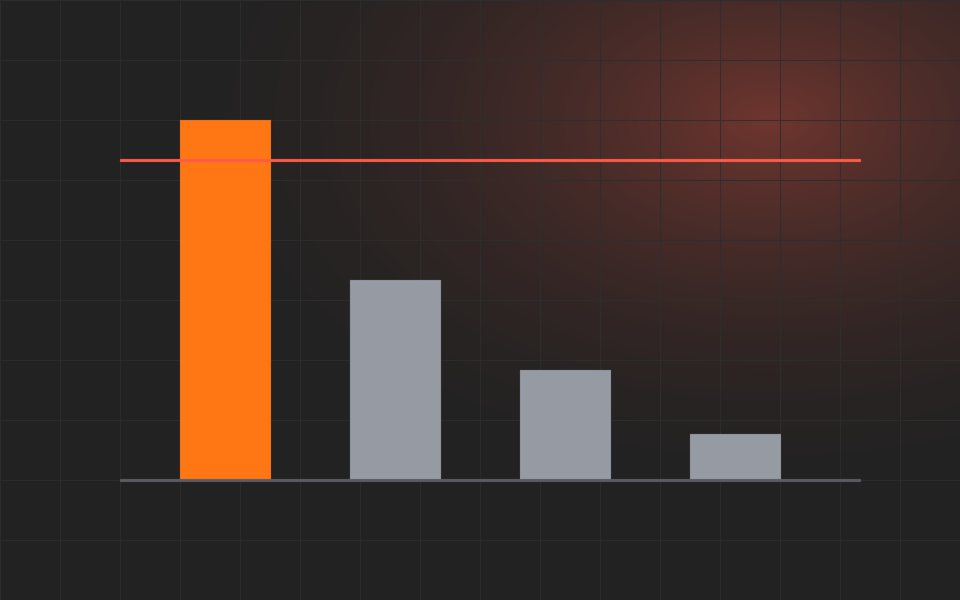
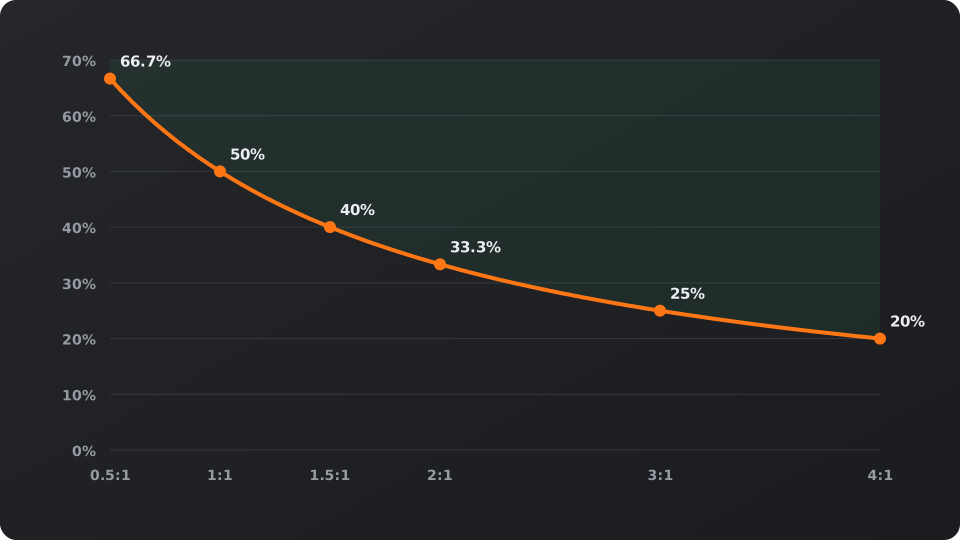
If every win is R:1 and every loss is 1R, you break even when win rate = 1 ÷ (1 + R).
- 1:1 needs a 50% win rate.
- 1.5:1 needs 40%.
- 2:1 needs about 33.3%.
- 3:1 needs 25%.
Higher reward-to-risk is not automatically better. Distant targets are hit less often, so the win rate usually falls as the target moves away. What matters is the pair, measured on your own trades.
Expectancy: the number to track
Expectancy = (win rate × average win) − (loss rate × average loss), in R per trade.
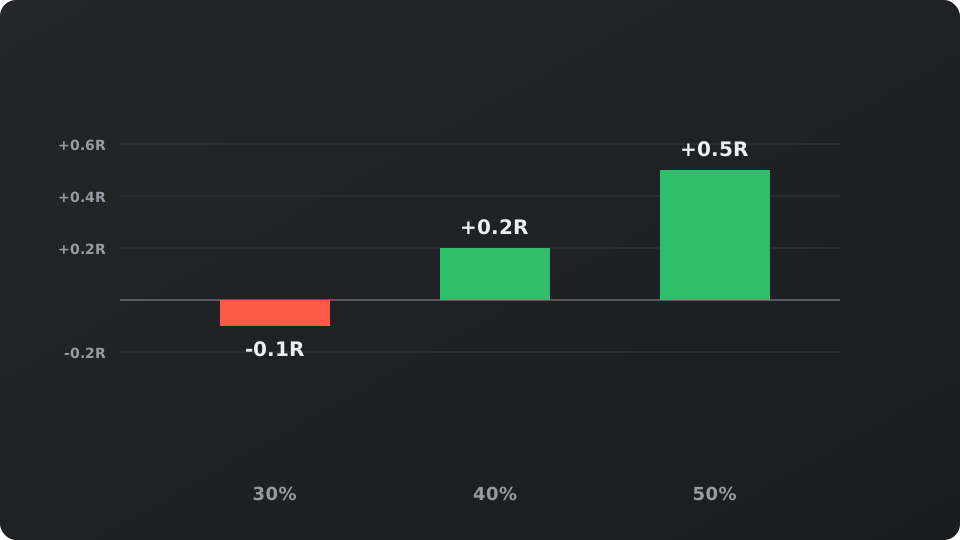
Assume a 2:1 setup. At a 30% win rate, expectancy is 0.3 × 2 − 0.7 × 1 = −0.1R: a slow loss. At 40% it is +0.2R. At 50% it is +0.5R.
At +0.2R and 1% risk per trade, 50 trades would add roughly 10R, about 10% of the account before compounding. It is an average, so real results come in uneven streaks.
Where fees and slippage bite
Fees are paid on every trade, winners and losers. On a tight stop they can be 0.1R or more per round trip. That turns a +0.2R edge into +0.1R and a thin edge into a loss.
Check the cost in R before you trade a short timeframe: fees on entry and exit divided by the risk per trade.
Partial exits change both numbers
Taking part of the position off early changes the average win and the win rate at the same time. Assume half the position exits at 1R and half at 2R: when both targets are hit, the average win is 1.5R, not 2R.
Moving the stop to entry after the first exit usually raises the win rate, because some trades now close at break-even instead of a full loss. Whether the trade-off helps is a question for your data, not your feelings. Log each exit separately so the journal shows the real average win and loss.
For education only, not financial advice. Trade examples are illustrative. Crypto prices are volatile, and leveraged trading can lose more than your margin.
Get one trade plan like this each week
Setup, stop, size and review in one email. Free, unsubscribe anytime.
Or follow the Telegram channel @ispsjaolqMarket now
Latest news