Bitcoin slips as oil jumps: how options and books are set
Bitcoin fell up to 2.2% from $84,254 as oil spiked before CPI. What options skew and order-book clusters say about positioning, with Coinlytic data.

On this page
Bitcoin surrendered the gains it made early in the week as US stocks opened on Monday, Cointelegraph reported, after reaching $84,254 on Bitstamp and then falling by as much as 2.2%. Oil jumped on new energy-infrastructure and tanker headlines just two days before US inflation data. This article looks at how options and exchange order books were positioned around the drop, and what that means for anyone holding leverage into CPI.
What happened
According to Cointelegraph, citing TradingView data, BTC/USD touched $84,254 on Bitstamp on Oct. 12, its highest since Wednesday, before sliding. Trading stayed inside a range.
The trigger was energy. Volodymyr Zelenskyy, Ukraine's president, said Russian strikes on energy infrastructure had not stopped despite a strike moratorium announced by US president Donald Trump. Iran separately reported that an oil tanker had been struck and was on fire in the Strait of Hormuz. WTI crude rose above $94 per barrel and Brent reached $107.25, its highest since Sept. 16.
The timing matters. US CPI is due Wednesday and PPI on Thursday, and Cointelegraph noted that CPI has been especially sensitive to higher oil prices. Not everyone read the oil move as lasting. Robin Brooks, formerly chief FX strategist at Goldman Sachs, argued oil carried too much risk premium, putting Persian Gulf flows near 13 mb/d, down from a recent high of 16.5 mb/d.
What the derivatives market showed
The options market did not read the pullback as a reason to buy heavy protection. QCP Capital said implied volatility, the price of expected movement, stayed elevated while spot drifted back inside its range. Risk reversals, which compare the price of puts with calls, showed a smaller premium for puts than usual.
QCP Capital summed it up this way: "the market looks less defensively positioned but still priced for a possible breakout". In plain terms, options traders were paying for movement without paying up much for downside cover. That leaves a market that is priced for a large move but not hedged hard against a fall.
Order books told a similar two-sided story. CoinGlass data cited by Cointelegraph showed sell orders clustered near $84,500, about $180 million at that level. Buy orders were building near $82,000, with spot drifting toward that area. For the day, analyst Rekt Capital pointed to $83,400 as the nearby resistance level. Clusters like these are where liquidity sits, and where stops and liquidations often gather. When price reaches them, they can absorb a move or accelerate it.
Where Bitcoin sits in Coinlytic's data
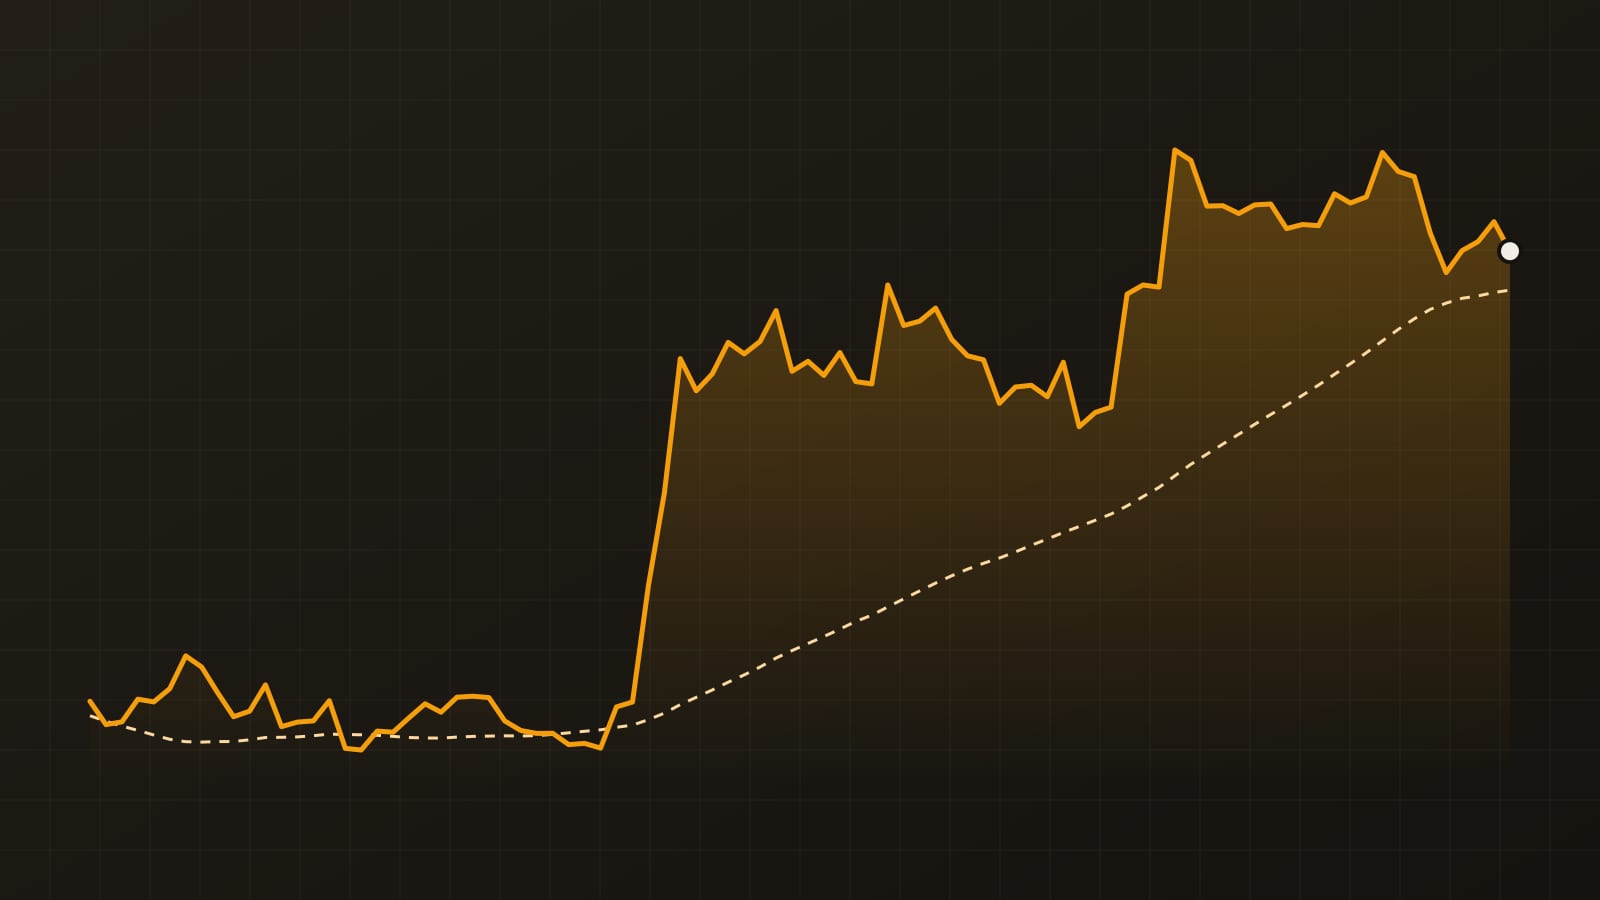
Coinlytic's figures from Bybit daily closes put the last close on 2026-10-13 at $82,740. That is down 3.3% over seven days, up 7.7% over 30 days and up 29.6% over 90 days.
The 90-day high close was $86,616 on 2026-09-21, and price is below it by 4.5%. The 90-day low close was $62,823 on 2026-08-01, with price above it by 31.7%. That places Bitcoin 84% of the way from the 90-day low to the 90-day high. The 50-day average stands at $81,121, and price is above it by 2.0%.
Read together: price is near the top of a strong three-month range, has cooled over the past week, and is sitting just above its 50-day average. Coinlytic's dataset for this article does not include funding or open-interest readings, so positioning here is drawn from the options and order-book data above.
A self-check before holding leverage into CPI
Firm implied volatility plus a thin put premium means the market is priced for movement in either direction. A trader using leverage can run through a few questions:
- Does my liquidation price sit beyond the nearby liquidity clusters, or inside them?
- Is my position size built for a CPI-day range, or for a quiet session?
- If oil headlines reverse quickly, does my plan still hold, or was oil my only reason for the trade?
- Am I relying on downside protection that the options market itself is not paying much for?
What to watch next
The CPI print on Wednesday and PPI on Thursday are the scheduled events. Watch whether oil holds its jump or fades, as Brooks suggested it could. Watch whether the put premium in risk reversals widens after the data, which would mark a shift to more defensive positioning. And watch how price behaves around the order-book clusters near $82,000 and $84,500, since that is where volatility risk and liquidation risk meet.
Sources
- Cointelegraph · October 12, 2026
Written with AI assistance from the reports named above. Figures, quotes and sources are checked automatically before publishing.
For education only, not financial advice. Trade examples are illustrative. Crypto prices are volatile, and leveraged trading can lose more than your margin.
Get one trade plan like this each week
Setup, stop, size and review in one email. Free, unsubscribe anytime.
Mid-week market-structure notes on Telegram: @ispsjaolqMarket brief
Latest news