- CAT
- Market data
- DATE
- October 21, 2026
- READ
- 6 min read
- SRC
- CryptoSlate +1
Bitcoin longs pay more funding as options skew climbs
Bitcoin futures longs paid 49.4% more funding while options skew rose to 8.6%. What the split means for leverage near $80,000.
[≡] On this page06
Bitcoin's derivatives market is sending mixed signals. Futures longs paid more to keep their bets open last week, while options traders paid more for protection against a fall, CryptoSlate reported, citing Glassnode data. This article looks at who is crowded, what it costs to stay in, and what a break of the $80,000 area could force out.
What happened: two markets, two moods
CryptoSlate's report, built on a Glassnode study dated Oct. 19, describes a split. On one side, leveraged traders in perpetual futures kept their bullish exposure and paid more for it. On the other, options traders moved toward defence. Spot buyers were the missing piece: aggressive selling outweighed aggressive buying on the exchanges Glassnode covers.
Bitcoin was near $81,300 when CryptoSlate published, more than 2% below the prior week. On Coinlytic's Bybit data the last daily close is $83,117, up 1.8% over 7 days but down 4.0% over 30 days. The market has bounced since, but it has not left the zone where this split matters.
What is funding rate, and why longs are paying more
A perpetual future has no expiry date. To keep its price tied to the spot market, traders on one side pay traders on the other at set intervals. That payment is the funding rate. When the perpetual trades above spot, longs usually pay shorts; when it trades below, shorts pay longs. CryptoSlate described the same mechanism: the exchange of funding between the two sides is what anchors perpetual prices to the underlying asset.
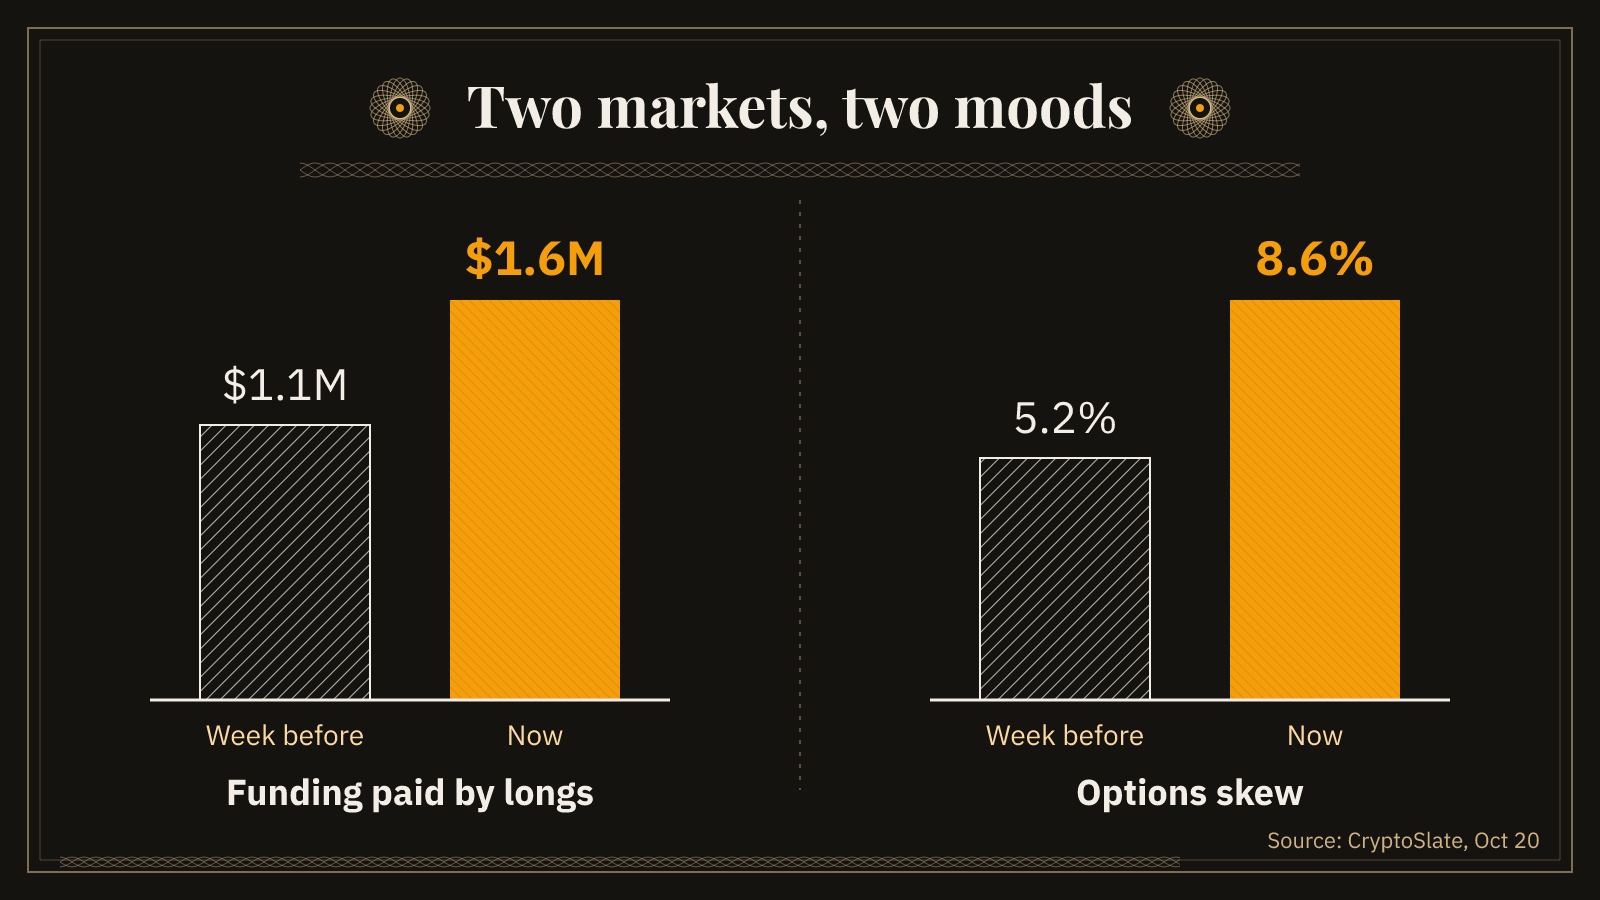
Glassnode's figure for funding paid by perpetual longs reached $1.6 million, against $1.1 million a week before, a jump of 49.4%. That brought it back into its normal statistical range. In plain terms, longs are again willing to pay a fee each funding window to keep their positions. That fee is a running cost. It does not show up on the price chart, but it comes out of the account every period the position stays open.
The odd part is that open interest did not grow with it. Bitcoin futures open interest stood at $36.4 billion versus $36.5 billion the week before, a 0.3% dip. Open interest counts the contracts still open. Flat open interest with higher funding suggests the same crowd is paying more to hold, rather than a new crowd arriving. CryptoSlate also noted that open interest sits near the high end of its historical range, so the stock of leverage is already large.
Crypto options: what a rising skew is telling you
An option gives the right, not the obligation, to buy or sell at a set price. A put protects against a fall; a call pays off on a rise. The 25-delta skew compares the price of comparable puts and calls. Per Glassnode, it climbed from 5.2% to 8.6% in one week, a rise of 3.4 percentage points. Puts became more expensive relative to calls. Someone is paying up to insure against downside.
Two other options readings point the same way. Bitcoin options open interest grew 3.1% to $38.6 billion, up from $37.4 billion, so more positions are open, not fewer. And the gap between implied and realized volatility flipped to +2.1% from -3.8%. Implied volatility is the movement priced into options; realized volatility is the movement that actually happened. When implied runs above realized, options buyers are paying for swings that recent trading has not delivered.
There is a limit to the alarm. CryptoSlate noted the skew is still below the top of its historical statistical range. The options market is defensive, not panicked.
Spot is the weak leg
Cumulative volume delta, or CVD, tracks whether aggressive buyers or aggressive sellers are doing more of the trading. In spot, Glassnode's CVD worsened to -$83.6 million from -$67 million, a 24.7% deterioration, while spot volume only edged up to $5.5 billion versus $5.4 billion. In perpetuals the picture improved: CVD came in at -$562.7 million versus -$891.1 million, a 36.9% recovery, but still under its lower band. Futures selling has eased, spot selling has not, and options buyers are hedging in between.
On-chain readings cited by CryptoSlate add sensitivity. Supply held in profit fell from 70.1% to 68.2%, and coins held by newer buyers grew as a share of those held by long-term holders, from 14.5% to 14.7%. Newer holders tend to react faster to price moves, which matters when leverage is stacked near one level.
Less leverage, thinner books: why moves can still be sharp
A year after the $19 billion liquidation crash, the market carries less leverage than it did then. Kaiko data cited by Coinlytic shows bitcoin perpetual open interest still 16% below its pre-crash level. That sounds reassuring. But Kaiko's figures also show spot market depth down 27%, and leverage per dollar of depth down 20%.
Depth is the volume of resting orders near the current price. It is what absorbs a forced sale. A liquidation is an exchange closing a position automatically once losses eat through the margin, and each forced sale hits the book as a market order. When depth shrinks, a smaller wave of liquidations can move price further, because there are fewer bids to sell into. This is liquidity risk layered on top of volatility risk: the move gets bigger because the book is thinner, not because there is more leverage.
Put the pieces together. Futures longs are paying more to hold. Open interest is near the top of its range. Spot selling still outweighs spot buying. Books are thinner than a year ago. CryptoSlate named $80,000 as the immediate level to defend, and said a fresh breakdown could push leveraged longs to cut exposure, adding to selling. Coinlytic's 50-day average sits at $81,722, with price above it by 1.7%, so the room between today's price and the area the market is watching is not wide.
Where the market sits now and what to re-check
Coinlytic's Bybit data puts bitcoin 85% of the way from its 90-day low to its 90-day high. The 90-day high close was $86,616, and price is below it by 4.0%. The 90-day low close was $62,823. Over 90 days bitcoin is up 29.6%. That range is wide, a reminder that a position sized for a quiet week can be too large for a fast one.
- Do I know what I pay in funding each period, and does my plan still work if that cost stays where it is for weeks?
- Where is my liquidation price relative to the $80,000 area, and how far could thin order books let price jump past it?
- Is my position size set from my stop distance, or from the leverage the exchange allows?
- If options are pricing more volatility than recent trading shows, have I widened my own risk assumptions to match?
What to watch next: the Federal Reserve meeting on Oct. 27–28, which CryptoSlate named as another possible catalyst; whether long-side funding keeps rising without new open interest; whether the 25-delta skew moves toward the top of its range; and whether spot CVD stops deteriorating. A change in any one of these would shift who is crowded and who is exposed.
Sources
- CryptoSlate · October 20, 2026
- Coinlytic Telegram channel · October 20, 2026
Written with AI assistance from the reports named above. Figures, quotes and sources are checked automatically before publishing.
For education only, not financial advice. Trade examples are illustrative. Crypto prices are volatile, and leveraged trading can lose more than your margin.
Get one trade plan like this each week
Setup, stop, size and review in one email. Free, unsubscribe anytime.
Mid-week market-structure notes on Telegram: @ispsjaolq